Linear Regression for Machine Learning
Introduction
Linear Regression is one of the basic concept used in Machine Learning. Do not think it’s complex as it’s related to Machine Learning. You have studied linear regression and even used without knowing it all your life.
Linear regression is a simple statistics technique that predicts the value of an output variable(response) based on one or more input input(predictor) variables. At the end of performing linear regression we will have a linear relationship (a mathematical formula) between the input variable(s) and the response variable. Based on the derived formula we can estimate the value of the response, when some new input variable is given.
For example let us consider a simple example. The below table gives you the distance you travel at the end of each hour in your car. At the end of first hour you would have gone 60 miles away and 120 miles at the end of second hour.
| Hour | Distance(Miles) |
|---|---|
| 0 | 0 |
| 1 | 60 |
| 2 | 120 |
| 3 | 180 |
In the above example, “Hours” in the input variable and “Distance” is the output variable. The output variable is dependent on the input variable as the output value changes based on the input value. Can you predict how much distance your car could have gone at the end of 4th hour? Easy to predict the output as 240 miles, isn’t?
So linear regression is all about prediction and it’s one of the Supervised Machine Learning type.
In general any such linear regression problem can be mathematically represented as below.
Y = a + bX
Where:
- X : input or independent variable
- Y : output or dependent variable
- a : constant
- b : coefficient
Our aim is to find the values of “a” and “b” so that we can find output “Y” for a given input “X”.
Plotting Data
When we plot the data for our example, it would look similar to the image below. It exactly defines the relationship between input and output variables.
Our example have just one input variable called “Hour” and so it’s called Univariate Linear Regression. Here are someother examples which have perfect relationship between input and output variables.
- Finding Cirumference of a circle based on it’s diameter.
- Finding Celcius value of Fahrenheit degree temperature.
For all these simple examples, the chart looks similar as shown above.
Real world problem have much complex data and also have many more input parameters. Also they are not perfectly related to each other. To be more precise, let us consider the below examples.
House Price Vs. Number of Rooms: We all know that if number of rooms in the house increases, price of the house increases. But the increase is not perfectly gradual. Also price may vary based on the locality of the house and other factors like road-facing, beach view, etc.
Height Vs. Weight: As height increases, you’d expect weight to increase, but not perfectly. We don’t have any exact formula to find the increacement value.
Alcohol Consumed Vs. Blood Alcohol Content: As alcohol consumption increases, we expect blood alcohol content to increase in one’s body. However the relationship is not perfect.
To understand better, let us see some data for the problem of Height Vs. Weight.
| Height | Weight |
|---|---|
| 63 | 127 |
| 64 | 121 |
| 66 | 142 |
| 69 | 157 |
| 69 | 162 |
| 71 | 156 |
| 71 | 169 |
| 72 | 165 |
| 73 | 181 |
| 75 | 208 |
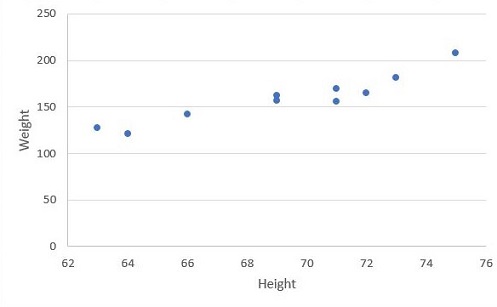
On plotting the above data, we get the below chart. Unlike our previous chart, you can see that the values are scattered and it’s not possible have a line pass through all the points.

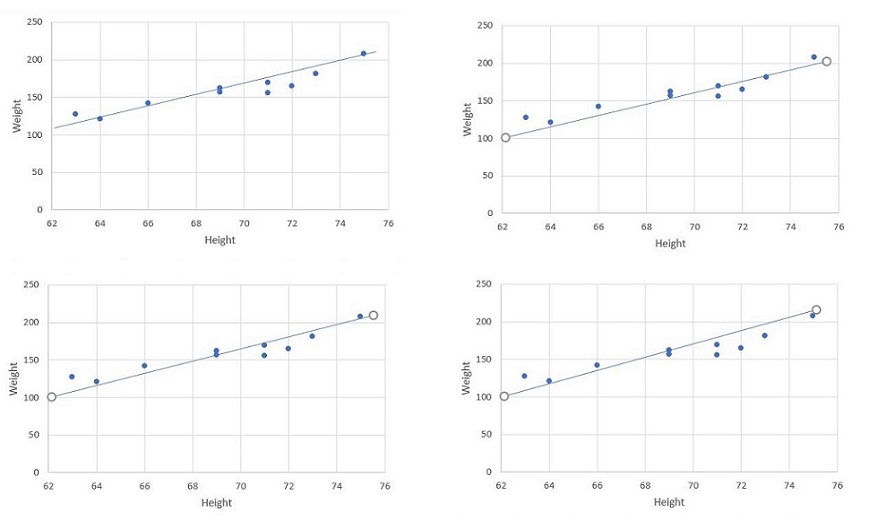
For this given problem, how do you predict weight of your friend who height is not in the list? This is where the prediction using linear regression comes to our help. We can plot a line across the points so that we can predict the value. But wait. There are several possibilities to draw a line for the given data points. Some of the possible ways are shown below.

Predicting the value depends on this line. But from the several ways of plotting a line, I would say the below is the best fit line.
How can one say this is the best fit for the given scattered data?